

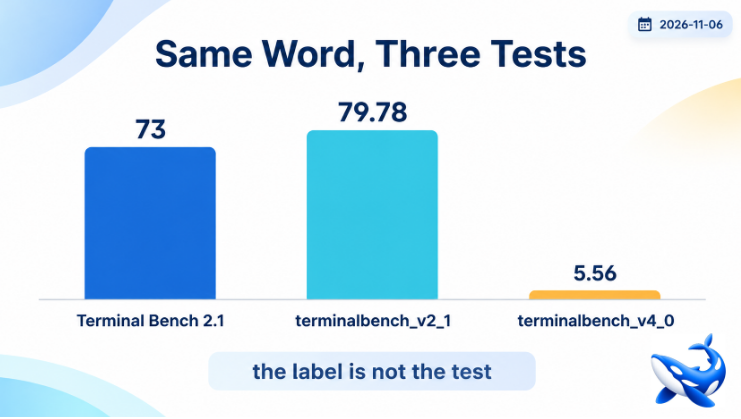
On OrcaRouter one page carries three benchmarks with the same name and wildly different scores. The benchmark table on Qwen3.8 27B model has 29 rows, and the most useful thing on it is a contradiction. Three rows describe a terminal benchmark. One reads 73, one reads 79.78, one reads 5.56 [VENDOR]. Same model, same week, same page — and a spread wide enough to make any single number useless unless you know which test it came from.
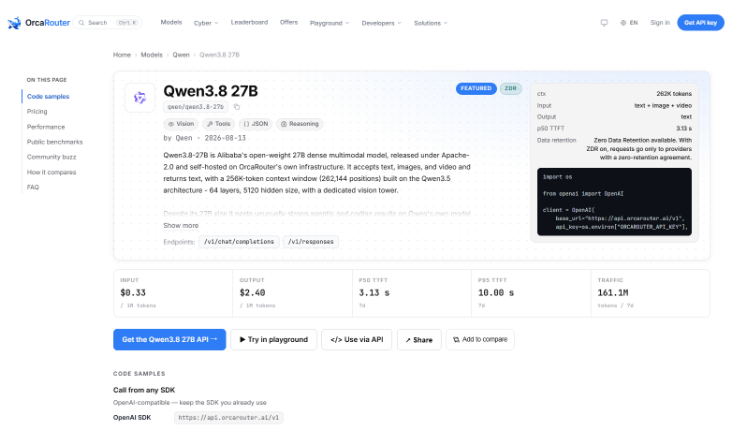
The card is $0.33 in / $2.40 out through OrcaRouter with a 262,144-token context. The price is simple; the table is where the work is.
What the three rows are
Terminal Bench 2.1 (Terminus), 73. A public benchmark with a documented harness; the parenthetical names the agent scaffold.
terminalbench_v2_1, 79.78. The same generation of the benchmark, reported under the raw identifier — a different run, a different scaffold, or a different subset.
terminalbench_v4_0, 5.56. A different version of the benchmark entirely, and a score that would describe a model unable to use a terminal at all.
The last number is not a contradiction of the first two. It is a different test. A v4 harness typically changes the task set, the time limits and the agent loop; a card evaluated on v2 can be excellent and fall over on v4 for reasons that have nothing to do with the model.
The lesson generalises to every benchmark table: the row name is not the test. Two rows with the same words can measure different things, and a buyer comparing “terminal score” across two cards may be comparing two different exams.
What the rest of the table says
Read as a profile rather than a ranking:
| area | rows | reading |
| science knowledge | GPQA Diamond 90.5 | flagship-class |
| competitive coding | LiveCodeBench v6 90.3 | flagship-class |
| desktop/browser automation | OSWorld 84.3, WebArena 64.8 | strong |
| repository-scale coding | SWE-bench Pro 61.7, QwenSWEBench 79 | competent |
| document understanding | OmniDocBench 1.5 91.1, CharXiv 78.8 | strong |
| general index | AA Intelligence 20.1, HLE 33.9 | bottom fifth |
| terminal, new harness | terminalbench_v4_0 5.56 | fails |
That is a specialist’s fingerprint: excellent inside a class, unremarkable outside it, and honest enough to publish the row that goes badly.
The rows a buyer should actually use
The class you are in. If your work is science QA or competitive programming, rows 1 and 2 are your evaluation. If it is repository-scale engineering, rows 4 and 5 are.
The long-context row. Long-Context Recall 82 matters because the card’s window is 262,144 tokens — a quarter of what the flagship cards offer. A high recall inside a smaller window is the right combination for a specialist [VENDOR].
The row that fails. A published 5.56 tells you the card has not been tuned for that harness. If your pipeline uses a terminal agent built on a v4-style loop, this is the one number that should stop you.
The error rate. Not a benchmark row, but the most decision-relevant number on the card: 0.090% over seven days, the lowest in this batch [OURS].
How to compare it with another card
Three rules, each of which the table above violates if you read it naively.
Compare row to row, never average to average. A composite index weights task families; if your workload is one family, the composite is measuring something you do not do.
Check the harness before comparing scores. A 73 on a Terminus scaffold and a 79.78 on a raw run are not a 9% improvement; they may be the same performance.
Prefer a published failure to a missing row. This table includes 5.56; many cards in the catalogue publish nothing at all. A vendor that shows the bad row is telling you where the model ends, which is more useful than a table of only-good numbers.
A table you can rebuild with your own tasks
Vendor rows are a starting point. The version that decides a purchase is twenty tasks from your own queue, scored blind.
Pick by class, not by score. If your work is repository review, take twenty reviews; if it is science QA, take questions from your own domain.
Score three ways. Correct, usable-after-editing, wrong-in-a-way-that-misleads. The third column is the one that costs money and it never appears on a benchmark table.
Keep the harness fixed. Same prompts, same scaffold, same limits for every card. A comparison where one card gets a better agent loop is a comparison of the loops.
Repeat quarterly. Model scores move; the card’s own table already disagrees with itself across harness versions, which is the best evidence for building your own.
The table’s second use
Beyond choosing the card, the table tells you what the card was trained for.
Research-y benchmarks are its home. GPQA and LiveCodeBench at 90-plus say the model was built on problems with verifiable answers.
Document benchmarks are strong but secondary. OmniDocBench 91.1 and CharXiv 78.8 say it reads structured documents well, which pairs with the 262,144-token window.
Agentic benchmarks are the weak signal. The low `terminalbench_v4_0` and a JobBench of 33.4 say it is not a tool-using agent, whatever its tool-call capability implies.
The general index is the honest headline. 20.1 is where a buyer who ignores everything else would land, and it is not flattering.
Reading a table as a description of training beats reading it as a leaderboard position — the first tells you where it will work, the second only tells you where it ranks, and the ranking changes with every harness revision.
The number to carry away
73, 79.78 and 5.56. Three terminal benchmarks on one card, and the only way to read them is to ask which harness each came from. A table that disagrees with itself is more honest than one that does not, and it is the best argument for scoring your own tasks. The spread between the three terminal rows is the strongest argument on the page for running your own harness rather than trusting anyone’s.
The takeaway
A 29-row table with three terminal benchmarks reading 73, 79.78 and 5.56 is not a contradiction — it is three different tests, and the lesson is to read row names as labels rather than specifications. Use the rows that describe your class, check the harness before comparing cards, and treat this card’s published failure as the most informative number on the page after its 0.090% error rate.
Sourcing note: pricing and context are catalogue records; latency, throughput, error rate and traffic figures are OrcaRouter production telemetry for the seven days ending 2026-11-05 [OURS]. Every benchmark figure is published on the model page and reproduced as the vendor’s claim, unreproduced [VENDOR]. Harness descriptions are inferred from the row identifiers and are stated as such. Checked 2026-11-06.